

Abstract
Background
Myelodysplastic syndromes (MDS) and chronic myelomonocytic leukemia (CMML) are mainly diagnosed based on morphological changes in the bone marrow. The diagnosis can be challenging in patients (pts) with pancytopenia with minimal dysplasia, and is subject to inter-observer variability. Somatic mutations can be identified in either disease but no genes, in isolation or in combination, are specific for disease phenotype.
We developed a geno-clinical model that uses mutational data, peripheral blood values, and clinical variables to predict an MDS vs. CMML diagnosis in pts who presented with cytopenias, in the absence of bone marrow biopsy results.
Method
We combined genomic and clinical data from 1897 pts treated at our institution (593) and the Munich Leukemia Laboratory (1304). Pts were diagnosed with MDS or CMML according to 2008 WHO criteria. Diagnosis of MDS and CMML was confirmed by independent hematopathologists that were not associated with the study. A genomic panel of 40 genes commonly mutated in myeloid malignancies was included. The initial cohort was randomly (computer generated) divided into learner (80%) and validation (20%) cohorts. Multiple machine learning algorithms were applied to predict the phenotype. Feature extraction algorithms were used to extract genomic/clinical variables that impacted the algorithm decision and to visualize the impact of each variable on phenotype. Prediction performance was evaluated according to the area under the curve of the receiver operator characteristic (ROC-AUC) and confusion/accuracy matrices.
Results
Of 1897 pts included, 1368 pts had MDS and 529 had CMML. The median age for the entire cohort was 72 years (range, 11-102); 37% were female. The median white blood cell count (WBC) was 5.1x10⁹/L (range, 0.60-176), absolute monocyte count (AMC) 0.19 x10⁹/L (range, 0-96), absolute lymphocyte count (ALC) 0.77x10⁹/L (range, 0-62), absolute neutrophil count (ANC) 2.44x10⁹/L (range, 0-170), hemoglobin (Hgb) 10.2 (range, 3.9-19.6), and platelet (Plt) count 111x103/mL (range 2-1491).
The most commonly mutated genes in all pts were: TET2 (33%), ASXL1 (26%), SF3B1 (21%), SRSF2 (16%), RUNX1 (12%), DNMT3A (10%), CBL (7%), U2AF1 (7%), STAG2 (6%), EZH2 (6%), ZRSR2 (6%), NRAS (6%). In CMML, they were: TET2 (51%), ASXL1 (43%), SRSF2 (25%), RUNX1 (18%), CBL (16%), KRAS (12%), NRAS (11%), EZH2 (9%), JAK2 (6%), U2AF1 (5%), SF3B1 (4%), and DNMT3A (3%). In MDS, they were: TET2 (27%), SF3B1 (24%), ASXL1 (21%), SRSF2 (13%), DNMT3A (12%), RUNX1 (10%), STAG2 (8%), U2AF1 (8%), ZRSR2 (7%), TP53 (7%), BCOR (5%), and EZH2 (5%).The median total number of mutations/sample was 2 (range 0-27) for all pts, 2 (range 0-8) for CMML, and 2 (range 0-27) for MDS.
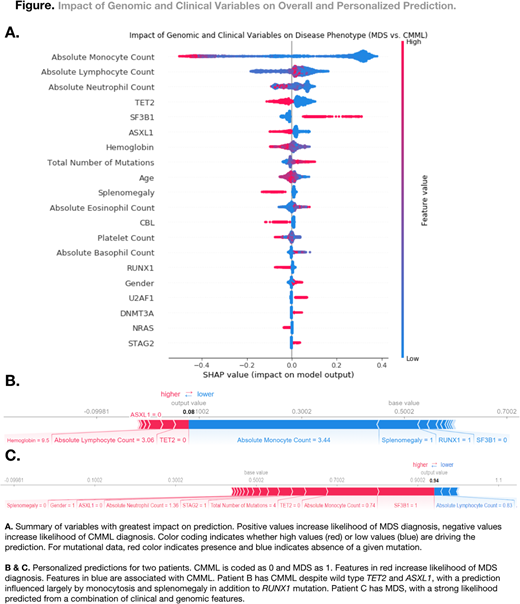
A set of 83 genomic/clinical variables were evaluated and several feature extraction algorithms were used to identify the least number of variables that have the most significant impact on the algorithm's decision. These variables included: AMC, ALC, TET2, ANC, ASXL1, SF3B1, Hgb, number of mutations/sample, AEC, age, Plt, splenomegaly, RUNX1, NRAS, CBL, U2AF1, STAG2, DNMT3A, TP53, EZH2, SRSF2, and ZRSR2, Figure 1.
When applying the model to the validation cohort, the ROC-AUC was .98 with an accuracy of 94%, with other statistical values as follows: specificities CMML 93%, MDS 96%; sensitivities CMML 96%, MDS 93%; positive predictive values CMML 84%, MDS 98%; negative predictive values CMML 98%, MDS 84%.
Individual pt data can also be entered into the model, with a probability of whether the diagnosis is MDS vs. CMML provided along with the impact of each variable on the decision, as shown in Figure 1.
When the analysis was restricted to mutations only, the accuracy of the model dropped dramatically (77%, ROC-AUC .85).
Conclusions
We propose a novel approach using interpretable, individualized modeling to predict MDS vs. CMML phenotypes based on genomic and clinical data without the need for bone marrow biopsy data. This approach can aid clinicians and hematopathologists when encountering pts with cytopenias and a diagnosis suspicious for MDS vs. CMML. The model also provides feature attributions that allow for quantitative understanding of the complex interplay among genotype, clinical variables, and phenotype.
Sekeres:Celgene: Membership on an entity's Board of Directors or advisory committees; Opsona: Membership on an entity's Board of Directors or advisory committees; Opsona: Membership on an entity's Board of Directors or advisory committees; Celgene: Membership on an entity's Board of Directors or advisory committees. Meggendorfer:MLL Munich Leukemia Laboratory: Employment. Walter:MLL Munich Leukemia Laboratory: Employment. Hutter:MLL Munich Leukemia Laboratory: Employment. Savona:Boehringer Ingelheim: Consultancy; Celgene: Consultancy, Membership on an entity's Board of Directors or advisory committees; Incyte: Membership on an entity's Board of Directors or advisory committees, Research Funding. Gerds:CTI Biopharma: Consultancy; Celgene: Consultancy; Apexx Oncology: Consultancy; Incyte: Consultancy. Sallman:Celgene: Research Funding, Speakers Bureau. Komrokji:Celgene: Honoraria, Research Funding; Novartis: Honoraria, Speakers Bureau; Celgene: Honoraria, Research Funding; Novartis: Honoraria, Speakers Bureau; Novartis: Honoraria, Speakers Bureau; Novartis: Honoraria, Speakers Bureau. Haferlach:MLL Munich Leukemia Laboratory: Employment, Equity Ownership. Maciejewski:Apellis Pharmaceuticals: Consultancy; Ra Pharmaceuticals, Inc: Consultancy; Apellis Pharmaceuticals: Consultancy; Ra Pharmaceuticals, Inc: Consultancy; Alexion Pharmaceuticals, Inc.: Consultancy, Membership on an entity's Board of Directors or advisory committees, Speakers Bureau; Alexion Pharmaceuticals, Inc.: Consultancy, Membership on an entity's Board of Directors or advisory committees, Speakers Bureau. Haferlach:MLL Munich Leukemia Laboratory: Employment, Equity Ownership. Nazha:MEI: Consultancy.

This feature is available to Subscribers Only
Sign In or Create an Account Close Modal